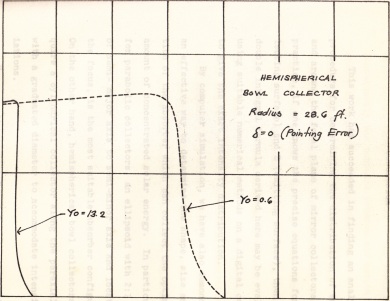
What we did in class is that we scanned a hand-drawn plot from an old thesis[1], and try to recreate the plot by obtaining the pixel values. The aim of the activity is to be able to recreate the plot.
The image was scanned, and then opened in paint. Using the tick marks that can be found in the image, I obtained an equation that relates the pixel values to the real-world data from which the graph stemmed from. The x and the y axis had different relation equation given by the following:
f(x) = 5.02E-5*x + 1.15E-5
f(y) = 1.43E-5*y -6.10E-5
where f(x) and f(y) are the real world numbers and x and y are the distances from the origin of the graph in pixels. The y coordinate of the pixel posed a little problem since the values for y pixels go downward. The remedy is just to subtract the current pixel value from the value of the origin to find the distance in pixels.
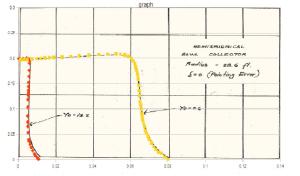
Points along the curvature of the plot are then tabulated. Many plot points are obtained so that the resulting graph would be much more accurate to the real graph. I did both of the curves, the dashed and the continuous one, as seen from the image below.
The yellow and red dots are the graph that i obtained after getting the pixel values and converting them into real world values. It can be observed that some discrepancy exists. this is due to the fact that the scanned image is slightly tilted. I have not put a correcting factor on this because there is not enough time left.
I would like to give myself 11 total points, since I was able to overlay the graph that i obtained to the original one.
[1] Domingo, Zenaida (1980) Computer simulation of the focusing properties of selected solar concentrations, M.S. Thesis. UP Dilimanb

